Insurance Agent Salary in Norwich, CT: $74,727 (2026)
Quick Answer:A full-time insurance agent in Norwich, CT earns a median $74,727/year (≈ $35.93/hour) in nominal terms for 2026 — projected from BLS OEWS 2025 (SOC 41-3021). Once you factor in Norwich's price level (0% above national, BEA RPP 100.4), that paycheck buys what $74,396 would nationally. Nominal pay sits 5.2% below the Connecticut state average.
Official BLS data · View source
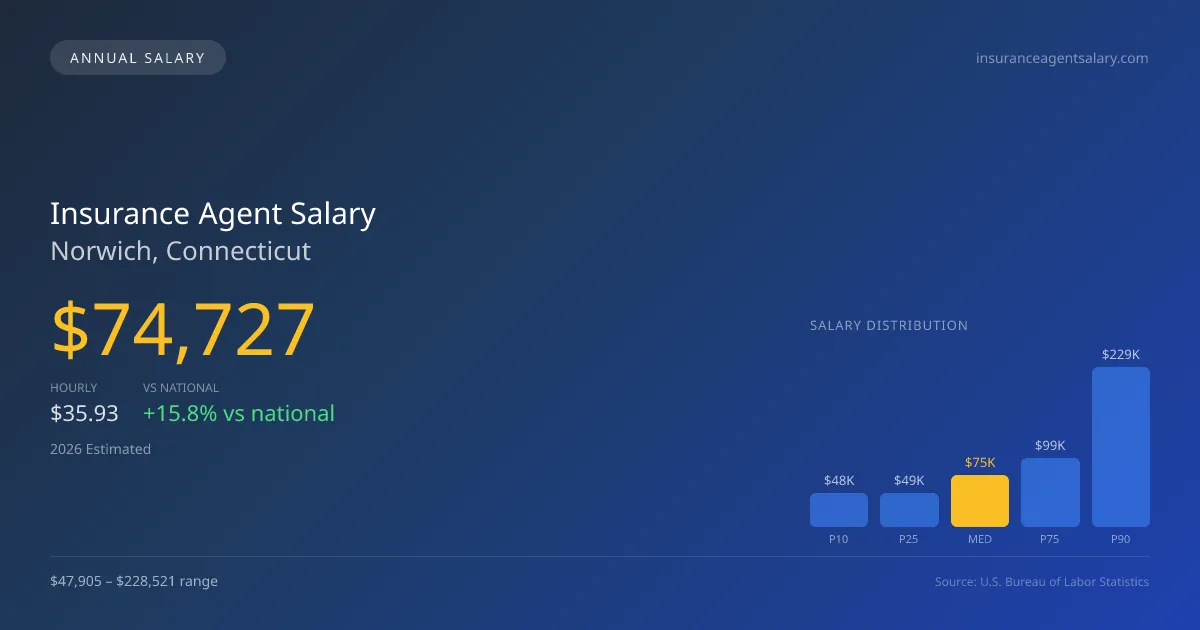
In 2026, insurance agents in Norwich, Connecticut, are projected to earn a median annual salary of $74,727. This figure represents a 15.82% increase over the national median of $64,522, indicating a stronger compensation structure in Norwich. Salaries can vary widely, ranging from $47,905 at the lower end (10th percentile) to $228,521 for top earners (90th percentile). This data comes from official Bureau of Labor Statistics (BLS) Occupational Employment and Wage Statistics (OEWS) surveys, reflecting the dynamics of the local job market. In Norwich, the competitive divide among captive agents working with major carriers like State Farm or Allstate, independent agents, and commercial brokers shapes pay scales considerably, highlighting the diverse opportunities available within the insurance sector.
Salary Breakdown
| Percentile | Annual | Hourly |
|---|---|---|
| Entry Level (P10) | $47,905 | $23.03 |
| Lower Range (P25) | $48,588 | $23.36 |
| Median (P50)(typical) | $74,727 | $35.93 |
| Upper Range (P75) | $98,834 | $47.52 |
| Top Earners (P90) | $228,521 | $109.87 |
Median Salary Position
15.82% above the national average
2026 Salary Percentile Distribution in Norwich
In Norwich, CT, the insurance agent salary spread from the 10th to 90th percentile is $180,616 (2026 est.). At $74,727, the local median is 15.82% above the national median of $64,522.
Salary Calculator
At 40 hours/week in Norwich: You'd be in the entry-level range
How Norwich Insurance Agent Pay Compares
Norwich median: $74,727/year (2026)
| Compared To | Median Salary | Norwich Pays |
|---|---|---|
| Connecticut Average | $78,826 | -5.20% less |
| National Average | $64,522 | +15.82% more |
Insurance Agents in Norwich, CT earn a median of $74,727 per year (2026 est.), which is 15.82% higher than the national median of $64,522 and 5.20% below the Connecticut state average of $78,826.
Cost-of-Living Adjusted Salary
Norwich has a cost of living 0.44% above the national average.
Adjusted salary = nominal × (100 / CoL index). CoL index: 100 = national average.
Norwich, CT has a cost-of-living index of 100.445 (above the national average of 100). While the nominal salary of $74,727 is competitive, the higher cost of living reduces purchasing power to an effective $74,396 — a 0.44% reduction.
Compare Purchasing Power
Select a city to see how your salary compares after cost of living
Select a city above to compare purchasing power
2019 BLS Actual
$48,750
2025 BLS Actual
$72,130
2026 Current Est.
$74,727
2019–2027 Growth
+58.8%
Salary Trajectory for Insurance Agents in Norwich (2019–2027)
2019–2025: actual BLS OEWS data for this metro area. 2026+: CAGR 3.60% projection.
| Year | Annual Salary | Status |
|---|---|---|
| 2019 | $48,750 | Actual |
| 2020 | $45,570 | Actual |
| 2021 | $48,460 | Actual |
| 2022 | $60,060 | Actual |
| 2023 | $62,230 | Actual |
| 2024 | $58,480 | Actual |
| 2025 | $72,130 | Actual |
| 2026(current) | $74,727 | Estimated |
| 2027 | $77,417 | Projected |
Based on 7 years of BLS OEWS data for the Norwich metropolitan area, the median insurance agent salary grew 48.0% from $48,750 (2019) to $72,130 (2025). At a 3.60% compound annual growth rate, salaries are projected to reach $77,417 by 2027 — a total increase of $28,667 (58.80%) from 2019.
Note: Historical values (2019–2025) are actual BLS OEWS figures for the Norwich metropolitan area, sourced from annual Occupational Employment and Wage Statistics surveys. 2026–2026 figures are current estimates, and 2027 values are projections, calculated using a 3.60% CAGR derived from 7-year BLS historical data. Actual salaries may vary based on employer, experience, certifications, and local market conditions.
Salary by Experience Level
| Experience | Estimated Salary Range |
|---|---|
| 0-2 years (New Graduate) | $47,905 – $48,588 |
| 3-5 years (Mid Career) | $48,588 – $74,727 |
| 5+ years (Experienced) | $74,727 – $98,834 |
| 10+ years (Top Earner) | $98,834 – $228,521 |
Agent salary ranges estimated from BLS percentile data. Individual insurance agent compensation varies by employer, certifications, and specialization.
Insurance Agent Job Market in Norwich
With around 150 insurance agents employed in Norwich, the market is robust yet faces challenges from a cost of living index of 100.445, which is slightly above the national average. This index impacts the actual purchasing power of agents, making negotiations for higher salaries essential for maximizing take-home income. Captive agents at firms such as Farmers or Liberty Mutual tend to receive stable pay but may not match the earnings potential of independent agents or large commercial brokerages, where commission structures for commercial lines can be significantly higher than for personal lines. The spread in pay can often be traced to factors such as the size of the book of business and the varying commission rates associated with different types of insurance policies. To enhance earning potential in Norwich, agents should consider diversifying their portfolios with commercial insurance and pursuing higher certifications like CPCU or CIC, which can create further opportunities for advancement and financial growth in this evolving market.
More salary data for Norwich, CT:
Frequently Asked Questions
How much do insurance agents make in Norwich, CT in 2026?
Is Norwich, CT a good place to work as a insurance agent?
Can insurance agents make $100K in Norwich?
What is the cost-of-living adjusted insurance agent salary in Norwich?
How much does a insurance agent make per hour in Norwich?
Related Pages
Compare Salaries
Career Resources
Nearby Cities in Connecticut
Written by Jordan Lee, MBA
Career Analyst
Jordan has over 10 years of experience in the insurance industry. He specializes in property and casualty insurance. He has worked in both agency and corporate settings.
Methodology & Data Source
Salary figures on this page are 2026 projections based on the Bureau of Labor Statistics Occupational Employment and Wage Statistics (OEWS) survey, May 2026 release. The BLS reported a median annual salary of $72,130 for insurance agentsin the Norwich metropolitan area. A 3.60% compound annual growth rate (CAGR), calculated from 6-year national BLS wage trends, was applied to project current 2026 compensation. Percentile ranges (P10–P90) represent the full salary distribution across experience levels and practice settings in this market.
Data Sources & Methodology
Source: BLS, OEWS, 7-year dataset (–). Per-city data from annual BLS metropolitan area surveys.
2026 figures are projected from 2025 BLS data using a compound annual growth rate (CAGR) of 3.60%, derived from historical BLS wage trends for insurance agents (SOC 41-3021).
Compiled and verified by Jordan Lee, MBA, a licensed insurance agent with 10+ years of clinical experience. · View source data at BLS.gov