Insurance Agent Salary in Tumwater, WA: $69,159 (2026)
Quick Answer:A full-time insurance agent in Tumwater, WA earns a median $69,159/year (≈ $33.25/hour) in nominal terms for 2026 — projected from BLS OEWS 2025 (SOC 41-3021). Once you factor in Tumwater's price level (7% above national, BEA RPP 107.4), that paycheck buys what $64,394 would nationally. Nominal pay sits 14.2% above the Washington state average.
Based on BLS state-level estimates · View source
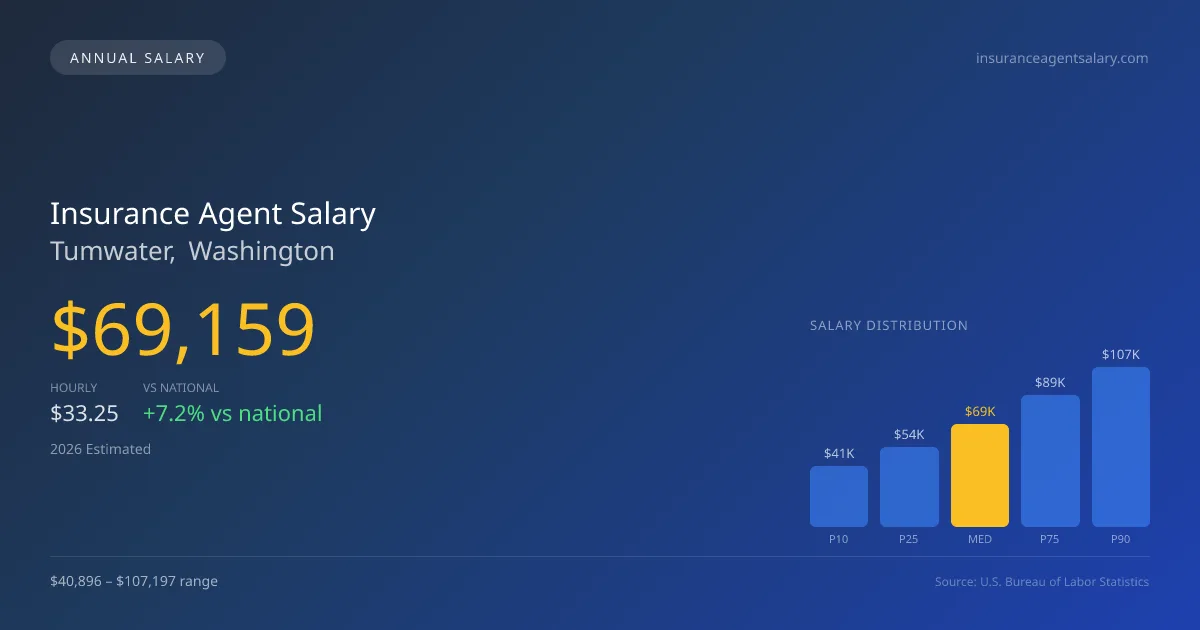
Insurance agents in Tumwater, Washington, can expect a median annual salary of $69,159 in 2026, reflecting a 7.19% increase over the national median of $64,522. Salary ranges from $40,896 at the 10th percentile to $107,197 at the 90th percentile, illustrating a significant disparity based on factors such as agency structure and client base. Local estimates, derived from 2025 BLS data and adjusted for cost of living, suggest that earnings may vary widely based on whether one works with captive agencies like State Farm or Allstate, independent agencies, or large commercial brokerages. The structural divide in insurance agency models influences salary potential, with commercial line specialists generally earning more than those focused on personal lines in the Tumwater job market.
About the Tumwater Market
Salary estimated from Washington average ($72,000) adjusted for local cost of living.
Salary Breakdown
| Percentile | Annual | Hourly |
|---|---|---|
| Entry Level (P10) | $40,896 | $19.66 |
| Lower Range (P25) | $53,853 | $25.89 |
| Median (P50)(typical) | $69,159 | $33.25 |
| Upper Range (P75) | $88,524 | $42.56 |
| Top Earners (P90) | $107,197 | $51.54 |
Median Salary Position
7.19% above the national average
2026 Salary Percentile Distribution in Tumwater
In Tumwater, WA, the insurance agent salary spread from the 10th to 90th percentile is $66,301 (2026 est.). At $69,159, the local median is 7.19% above the national median of $64,522.
Salary Calculator
At 40 hours/week in Tumwater: You'd be in the lower-middle range
How Tumwater Insurance Agent Pay Compares
Tumwater median: $69,159/year (2026)
| Compared To | Median Salary | Tumwater Pays |
|---|---|---|
| Washington Average | $60,560 | +14.20% more |
| National Average | $64,522 | +7.19% more |
Insurance Agents in Tumwater, WA earn a median of $69,159 per year (2026 est.), which is 7.19% higher than the national median of $64,522 and 14.20% above the Washington state average of $60,560.
Cost-of-Living Adjusted Salary
Tumwater has a cost of living 7.40% above the national average.
Adjusted salary = nominal × (100 / CoL index). CoL index: 100 = national average.
Tumwater, WA has a cost-of-living index of 107.4 (above the national average of 100). While the nominal salary of $69,159 is competitive, the higher cost of living reduces purchasing power to an effective $64,394 — a 6.89% reduction.
Compare Purchasing Power
Select a city to see how your salary compares after cost of living
Select a city above to compare purchasing power
2019 BLS Actual
$54,601
2025 BLS Actual
$66,756
2026 Current Est.
$69,159
2019–2027 Growth
+31.2%
Salary Trajectory for Insurance Agents in Tumwater (2019–2027)
2019–2025: actual BLS OEWS data for this metro area. 2026+: CAGR 3.60% projection.
| Year | Annual Salary | Status |
|---|---|---|
| 2019 | $54,601 | Actual |
| 2020 | $55,930 | Actual |
| 2021 | $53,422 | Actual |
| 2022 | $62,018 | Actual |
| 2023 | $63,326 | Actual |
| 2024 | $75,695 | Actual |
| 2025 | $66,756 | Actual |
| 2026(current) | $69,159 | Estimated |
| 2027 | $71,649 | Projected |
Based on 7 years of BLS OEWS data for the Tumwater metropolitan area, the median insurance agent salary grew 22.3% from $54,601 (2019) to $66,756 (2025). At a 3.60% compound annual growth rate, salaries are projected to reach $71,649 by 2027 — a total increase of $17,048 (31.22%) from 2019.
Note: Historical values (2019–2025) are actual BLS OEWS figures for the Tumwater metropolitan area, sourced from annual Occupational Employment and Wage Statistics surveys. 2026–2026 figures are current estimates, and 2027 values are projections, calculated using a 3.60% CAGR derived from 7-year BLS historical data. Actual salaries may vary based on employer, experience, certifications, and local market conditions.
Salary by Experience Level
| Experience | Estimated Salary Range |
|---|---|
| 0-2 years (New Graduate) | $40,896 – $53,853 |
| 3-5 years (Mid Career) | $53,853 – $69,159 |
| 5+ years (Experienced) | $69,159 – $88,524 |
| 10+ years (Top Earner) | $88,524 – $107,197 |
Agent salary ranges estimated from BLS percentile data. Individual insurance agent compensation varies by employer, certifications, and specialization.
Insurance Agent Job Market in Tumwater
The local job market in Tumwater comprises just six insurance agents, highlighting a smaller scale of operational dynamics in this area. With a cost of living index at 107.4, agents should consider purchasing power when evaluating their compensation. Captive agents at major carriers typically offer competitive salaries but may place caps on earnings potential, while independent agents and large brokerages like Aon or Marsh tend to provide higher commission structures, especially in commercial lines, which can yield 5-10 times the potential compensation of personal lines. To increase insurance agent pay in Tumwater, professionals should target larger book sizes and prioritize commercial insurance sales, where renewal commissions can compound significantly, thus enhancing overall income potential.
More salary data for Tumwater, WA:
Frequently Asked Questions
How much do insurance agents make in Tumwater, WA in 2026?
Is Tumwater, WA a good place to work as a insurance agent?
Can insurance agents make $100K in Tumwater?
What is the cost-of-living adjusted insurance agent salary in Tumwater?
How much does a insurance agent make per hour in Tumwater?
Related Pages
Compare Salaries
Career Resources
Nearby Cities in Washington
Written by Jordan Lee, MBA
Career Analyst
Jordan has over 10 years of experience in the insurance industry. He specializes in property and casualty insurance. He has worked in both agency and corporate settings.
Methodology & Data Source
Salary figures on this page are 2026 projections based on the Bureau of Labor Statistics Occupational Employment and Wage Statistics (OEWS) survey, May 2026 release. The BLS reported a median annual salary of $66,756 for insurance agentsin the Tumwater metropolitan area. A 3.60% compound annual growth rate (CAGR), calculated from 6-year national BLS wage trends, was applied to project current 2026 compensation. Percentile ranges (P10–P90) represent the full salary distribution across experience levels and practice settings in this market.
Data Sources & Methodology
Salary data for Tumwater is estimated from official BLS state-level occupational wage data (2025), adjusted for regional cost-of-living differences using BEA RPP (Regional Price Parities).
2026 figures are projected from 2025 BLS data using a compound annual growth rate (CAGR) of 3.60%, derived from historical BLS wage trends for insurance agents (SOC 41-3021).
Compiled and verified by Jordan Lee, MBA, a licensed insurance agent with 10+ years of clinical experience. · View source data at BLS.gov