Insurance Agent Salary in Cranston, RI: $63,428 (2026)
Quick Answer:A full-time insurance agent in Cranston, RI earns a median $63,428/year (≈ $30.49/hour) in nominal terms for 2026 — projected from BLS OEWS 2025 (SOC 41-3021). Once you factor in Cranston's price level (1% above national, BEA RPP 100.5), that paycheck buys what $63,112 would nationally. Nominal pay sits 2.2% below the Rhode Island state average.
Based on BLS state-level estimates · View source
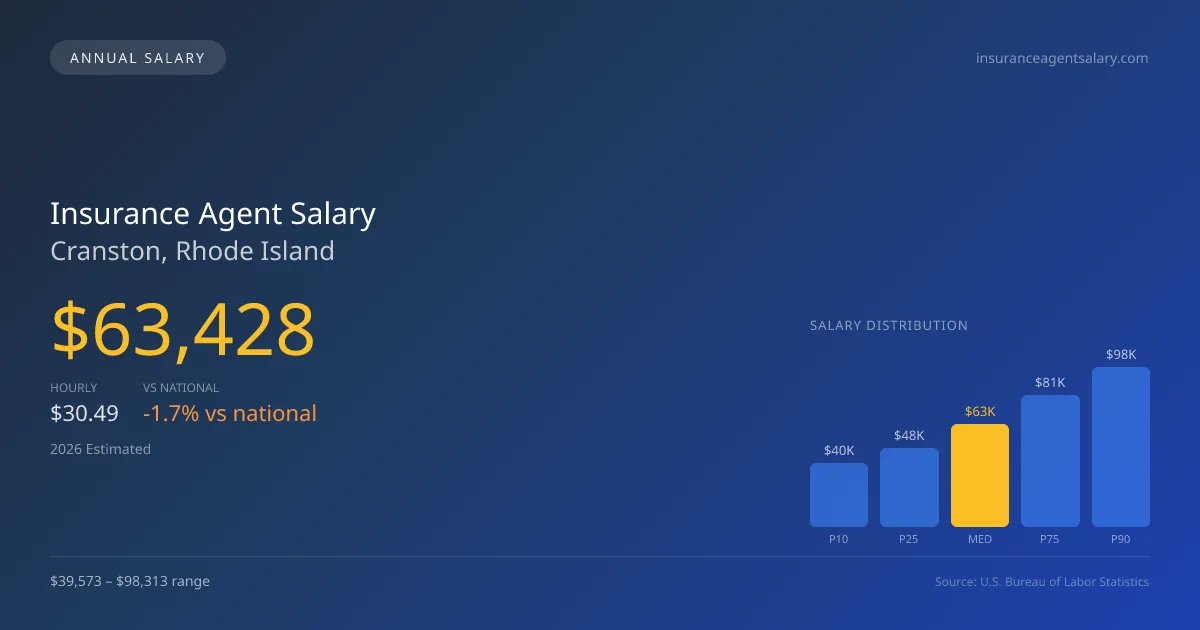
In Cranston, Rhode Island, the expected median annual salary for insurance agents in 2026 is $63,428, slightly below the national median of $64,522. The salary spectrum is broad, with earnings ranging from $39,573 at the 10th percentile to $98,313 at the 90th percentile. These figures are derived from the 2025 BLS data, adjusted for local economic conditions, indicating a strong potential for agents who build substantial books of business. Commission structures in this profession often reward longevity and client retention, as renewal commissions play a significant role in overall income, making it essential for agents in this city to nurture lasting client relationships to enhance their earning potential.
About the Cranston Market
Salary estimated from Rhode Island average ($62,000) adjusted for local cost of living.
Salary Breakdown
| Percentile | Annual | Hourly |
|---|---|---|
| Entry Level (P10) | $39,573 | $19.02 |
| Lower Range (P25) | $48,425 | $23.28 |
| Median (P50)(typical) | $63,428 | $30.49 |
| Upper Range (P75) | $81,188 | $39.04 |
| Top Earners (P90) | $98,313 | $47.26 |
Median Salary Position
1.7% below the national average
2026 Salary Percentile Distribution in Cranston
In Cranston, RI, the insurance agent salary spread from the 10th to 90th percentile is $58,740 (2026 est.). At $63,428, the local median is 1.7% below the national median of $64,522.
Salary Calculator
At 40 hours/week in Cranston: You'd be in the lower-middle range
How Cranston Insurance Agent Pay Compares
Cranston median: $63,428/year (2026)
| Compared To | Median Salary | Cranston Pays |
|---|---|---|
| Rhode Island Average | $64,855 | -2.20% less |
| National Average | $64,522 | -1.70% less |
Insurance Agents in Cranston, RI earn a median of $63,428 per year (2026 est.), which is 1.70% lower than the national median of $64,522 and 2.20% below the Rhode Island state average of $64,855.
Cost-of-Living Adjusted Salary
Cranston has a cost of living 0.50% above the national average.
Adjusted salary = nominal × (100 / CoL index). CoL index: 100 = national average.
Cranston, RI has a cost-of-living index of 100.5 (above the national average of 100). While the nominal salary of $63,428 is competitive, the higher cost of living reduces purchasing power to an effective $63,112 — a 0.5% reduction.
Compare Purchasing Power
Select a city to see how your salary compares after cost of living
Select a city above to compare purchasing power
2019 BLS Actual
$50,076
2025 BLS Actual
$61,224
2026 Current Est.
$63,428
2019–2027 Growth
+31.2%
Salary Trajectory for Insurance Agents in Cranston (2019–2027)
2019–2025: actual BLS OEWS data for this metro area. 2026+: CAGR 3.60% projection.
| Year | Annual Salary | Status |
|---|---|---|
| 2019 | $50,076 | Actual |
| 2020 | $51,295 | Actual |
| 2021 | $48,995 | Actual |
| 2022 | $56,879 | Actual |
| 2023 | $58,078 | Actual |
| 2024 | $60,949 | Actual |
| 2025 | $61,224 | Actual |
| 2026(current) | $63,428 | Estimated |
| 2027 | $65,711 | Projected |
Based on 7 years of BLS OEWS data for the Cranston metropolitan area, the median insurance agent salary grew 22.3% from $50,076 (2019) to $61,224 (2025). At a 3.60% compound annual growth rate, salaries are projected to reach $65,711 by 2027 — a total increase of $15,635 (31.22%) from 2019.
Note: Historical values (2019–2025) are actual BLS OEWS figures for the Cranston metropolitan area, sourced from annual Occupational Employment and Wage Statistics surveys. 2026–2026 figures are current estimates, and 2027 values are projections, calculated using a 3.60% CAGR derived from 7-year BLS historical data. Actual salaries may vary based on employer, experience, certifications, and local market conditions.
Salary by Experience Level
| Experience | Estimated Salary Range |
|---|---|
| 0-2 years (New Graduate) | $39,573 – $48,425 |
| 3-5 years (Mid Career) | $48,425 – $63,428 |
| 5+ years (Experienced) | $63,428 – $81,188 |
| 10+ years (Top Earner) | $81,188 – $98,313 |
Agent salary ranges estimated from BLS percentile data. Individual insurance agent compensation varies by employer, certifications, and specialization.
Insurance Agent Job Market in Cranston
The job market for insurance agents in Cranston remains stable, with approximately 12 professionals employed in the sector. A cost-of-living index of 100.5 suggests that salaries align closely with local economic conditions, impacting take-home pay and purchasing power. Major employers in the area include well-known captive carriers like State Farm and Allstate, which typically offer competitive base salaries along with training incentives. In contrast, independent agencies can provide higher upside potential through commission structures that allow for greater earnings on commercial lines compared to personal lines. To maximize pay in Cranston, agents should consider diversifying their portfolios and aiming for opportunities in commercial insurance, where commission rates can outperform those in personal lines work. Building a strong book of business through consistent client engagement will also be vital for enhancing long-term earnings.
More salary data for Cranston, RI:
Frequently Asked Questions
How much do insurance agents make in Cranston, RI in 2026?
Is Cranston, RI a good place to work as a insurance agent?
Can insurance agents make $100K in Cranston?
What is the cost-of-living adjusted insurance agent salary in Cranston?
How much does a insurance agent make per hour in Cranston?
Related Pages
Compare Salaries
Career Resources
Nearby Cities in Rhode Island
Written by Jordan Lee, MBA
Career Analyst
Jordan has over 10 years of experience in the insurance industry. He specializes in property and casualty insurance. He has worked in both agency and corporate settings.
Methodology & Data Source
Salary figures on this page are 2026 projections based on the Bureau of Labor Statistics Occupational Employment and Wage Statistics (OEWS) survey, May 2026 release. The BLS reported a median annual salary of $61,224 for insurance agentsin the Cranston metropolitan area. A 3.60% compound annual growth rate (CAGR), calculated from 6-year national BLS wage trends, was applied to project current 2026 compensation. Percentile ranges (P10–P90) represent the full salary distribution across experience levels and practice settings in this market.
Data Sources & Methodology
Salary data for Cranston is estimated from official BLS state-level occupational wage data (2025), adjusted for regional cost-of-living differences using BEA RPP (Regional Price Parities).
2026 figures are projected from 2025 BLS data using a compound annual growth rate (CAGR) of 3.60%, derived from historical BLS wage trends for insurance agents (SOC 41-3021).
Compiled and verified by Jordan Lee, MBA, a licensed insurance agent with 10+ years of clinical experience. · View source data at BLS.gov