Insurance Agent Salary in St. Paul, MN: $86,838 (2026)
Quick Answer:A full-time insurance agent in St. Paul, MN earns a median $86,838/year (≈ $41.75/hour) in nominal terms for 2026 — projected from BLS OEWS 2025 (SOC 41-3021). Once you factor in St. Paul's price level (1% below national, BEA RPP 98.5), that paycheck buys what $88,160 would nationally. Nominal pay sits 28.6% above the Minnesota state average.
Based on BLS state-level estimates · View source
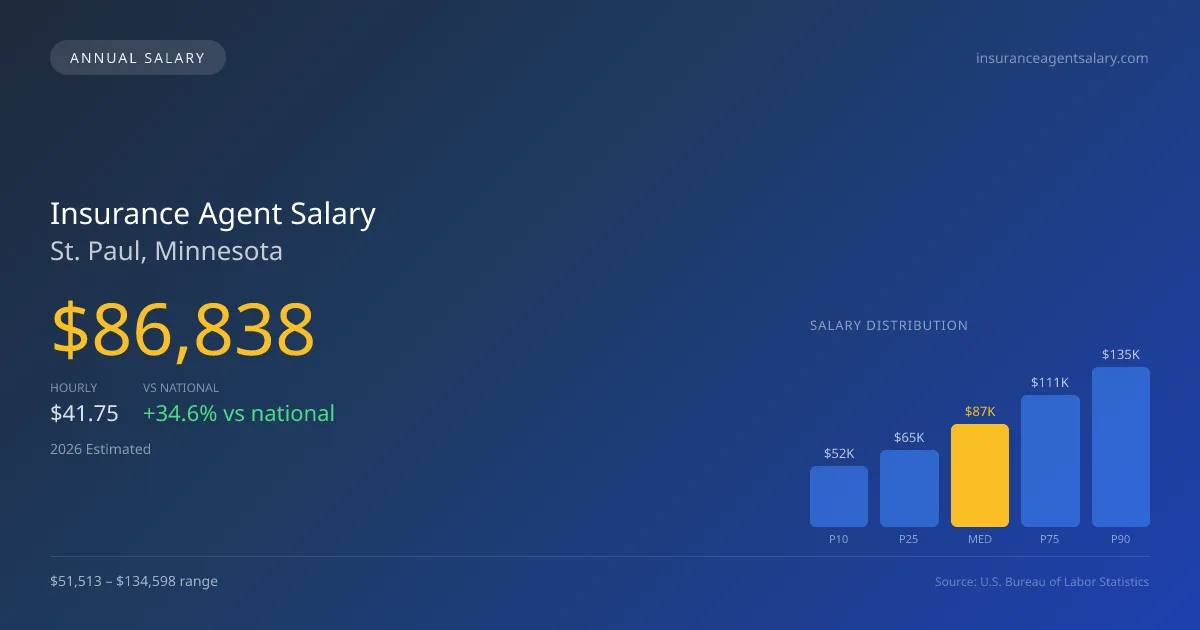
Insurance agents in St. Paul, Minnesota, can expect to earn a median annual salary of $86,838 in 2026, which is significantly higher than the national median of $64,522. The broad salary range for these professionals extends from $51,513 at the lower end (P10) to $134,598 at the higher end (P90), reflecting the diverse nature of the insurance market. These figures, derived from BLS state-level data and adjusted for regional cost considerations, indicate a competitive salary landscape especially favorable for those specializing in commercial or specialty lines compared to personal lines. This strong earning potential coupled with a relatively low cost of living index of 98.5 provides an appealing job market for insurance agents in St. Paul, MN.
About the St. Paul Market
Salary estimated from Minnesota average ($68,000) adjusted for local cost of living.
Salary Breakdown
| Percentile | Annual | Hourly |
|---|---|---|
| Entry Level (P10) | $51,513 | $24.77 |
| Lower Range (P25) | $64,895 | $31.20 |
| Median (P50)(typical) | $86,838 | $41.75 |
| Upper Range (P75) | $111,152 | $53.44 |
| Top Earners (P90) | $134,598 | $64.71 |
Median Salary Position
34.59% above the national average
2026 Salary Percentile Distribution in St. Paul
In St. Paul, MN, the insurance agent salary spread from the 10th to 90th percentile is $83,085 (2026 est.). At $86,838, the local median is 34.59% above the national median of $64,522.
Salary Calculator
At 40 hours/week in St. Paul: You'd be in the lower-middle range
How St. Paul Insurance Agent Pay Compares
St. Paul median: $86,838/year (2026)
| Compared To | Median Salary | St. Paul Pays |
|---|---|---|
| Minnesota Average | $67,525 | +28.60% more |
| National Average | $64,522 | +34.59% more |
Insurance Agents in St. Paul, MN earn a median of $86,838 per year (2026 est.), which is 34.59% higher than the national median of $64,522 and 28.60% above the Minnesota state average of $67,525.
Cost-of-Living Adjusted Salary
St. Paul has a cost of living 1.50% below the national average, meaning your salary goes further here.
Adjusted salary = nominal × (100 / CoL index). CoL index: 100 = national average.
St. Paul, MN has a cost-of-living index of 98.5 (below the national average of 100). A insurance agent earning $86,838 nominally has purchasing power equivalent to $88,160 in an average-cost city — an effective 1.52% boost.
Compare Purchasing Power
Select a city to see how your salary compares after cost of living
Select a city above to compare purchasing power
2019 BLS Actual
$68,558
2025 BLS Actual
$83,820
2026 Current Est.
$86,838
2019–2027 Growth
+31.2%
Salary Trajectory for Insurance Agents in St. Paul (2019–2027)
2019–2025: actual BLS OEWS data for this metro area. 2026+: CAGR 3.60% projection.
| Year | Annual Salary | Status |
|---|---|---|
| 2019 | $68,558 | Actual |
| 2020 | $70,227 | Actual |
| 2021 | $67,078 | Actual |
| 2022 | $77,871 | Actual |
| 2023 | $79,513 | Actual |
| 2024 | $69,623 | Actual |
| 2025 | $83,820 | Actual |
| 2026(current) | $86,838 | Estimated |
| 2027 | $89,964 | Projected |
Based on 7 years of BLS OEWS data for the St. Paul metropolitan area, the median insurance agent salary grew 22.3% from $68,558 (2019) to $83,820 (2025). At a 3.60% compound annual growth rate, salaries are projected to reach $89,964 by 2027 — a total increase of $21,406 (31.22%) from 2019.
Note: Historical values (2019–2025) are actual BLS OEWS figures for the St. Paul metropolitan area, sourced from annual Occupational Employment and Wage Statistics surveys. 2026–2026 figures are current estimates, and 2027 values are projections, calculated using a 3.60% CAGR derived from 7-year BLS historical data. Actual salaries may vary based on employer, experience, certifications, and local market conditions.
Salary by Experience Level
| Experience | Estimated Salary Range |
|---|---|
| 0-2 years (New Graduate) | $51,513 – $64,895 |
| 3-5 years (Mid Career) | $64,895 – $86,838 |
| 5+ years (Experienced) | $86,838 – $111,152 |
| 10+ years (Top Earner) | $111,152 – $134,598 |
Agent salary ranges estimated from BLS percentile data. Individual insurance agent compensation varies by employer, certifications, and specialization.
Insurance Agent Job Market in St. Paul
In St. Paul, the local job market employs approximately 80 insurance agents, a number that reflects a steady demand for insurance services in the region. With a cost of living index slightly below the national average, agents can enjoy enhanced purchasing power. Top-paying employers in the area include captive agents at single carriers like State Farm and Allstate, along with independent agencies and large brokerage firms such as Aon and Marsh. The differences in compensation often arise from agents' books of business, the characteristics of their commission structures, and their affiliations—commercial insurance accounts typically yield much higher commissions than personal lines. For those looking to maximize their insurance agent pay in St. Paul, developing a focused portfolio in commercial lines, seeking positions with independent brokerages, and considering agency ownership could be effective strategies to enhance income potential.
More salary data for St. Paul, MN:
Frequently Asked Questions
How much do insurance agents make in St. Paul, MN in 2026?
Is St. Paul, MN a good place to work as a insurance agent?
Can insurance agents make $100K in St. Paul?
What is the cost-of-living adjusted insurance agent salary in St. Paul?
How much does a insurance agent make per hour in St. Paul?
Related Pages
Compare Salaries
Career Resources
Nearby Cities in Minnesota
Written by Jordan Lee, MBA
Career Analyst
Jordan has over 10 years of experience in the insurance industry. He specializes in property and casualty insurance. He has worked in both agency and corporate settings.
Methodology & Data Source
Salary figures on this page are 2026 projections based on the Bureau of Labor Statistics Occupational Employment and Wage Statistics (OEWS) survey, May 2026 release. The BLS reported a median annual salary of $83,820 for insurance agentsin the St. Paul metropolitan area. A 3.60% compound annual growth rate (CAGR), calculated from 6-year national BLS wage trends, was applied to project current 2026 compensation. Percentile ranges (P10–P90) represent the full salary distribution across experience levels and practice settings in this market.
Data Sources & Methodology
Salary data for St. Paul is estimated from official BLS state-level occupational wage data (2025), adjusted for regional cost-of-living differences using BEA RPP (Regional Price Parities).
2026 figures are projected from 2025 BLS data using a compound annual growth rate (CAGR) of 3.60%, derived from historical BLS wage trends for insurance agents (SOC 41-3021).
Compiled and verified by Jordan Lee, MBA, a licensed insurance agent with 10+ years of clinical experience. · View source data at BLS.gov