Insurance Agent Salary in Oceanside, CA: $68,905 (2026)
Quick Answer:A full-time insurance agent in Oceanside, CA earns a median $68,905/year (≈ $33.13/hour) in nominal terms for 2026 — projected from BLS OEWS 2025 (SOC 41-3021). Once you factor in Oceanside's price level (13% above national, BEA RPP 113.1), that paycheck buys what $60,924 would nationally. Nominal pay sits 1.5% above the California state average.
Based on BLS state-level estimates · View source
In Oceanside, California, insurance agents can expect a median annual salary of $68,905 in 2026, reflecting a 6.79% increase over the national median of $64,522. The projected salary range spans from $39,965 at the 10th percentile to $106,803 at the 90th percentile, showcasing the various earning potentials available in this market. These figures are based on 2025 BLS OEWS data, projected to 2026 with regional price adjustments considered. With 28 insurance agents currently employed in this vibrant community, the local job market offers promising prospects for individuals entering or advancing in the insurance field.
About the Oceanside Market
Salary estimated from California average ($82,000) adjusted for local cost of living.
Salary Breakdown
| Percentile | Annual | Hourly |
|---|---|---|
| Entry Level (P10) | $39,965 | $19.22 |
| Lower Range (P25) | $49,612 | $23.85 |
| Median (P50)(typical) | $68,905 | $33.13 |
| Upper Range (P75) | $88,199 | $42.40 |
| Top Earners (P90) | $106,803 | $51.34 |
Median Salary Position
6.79% above the national average
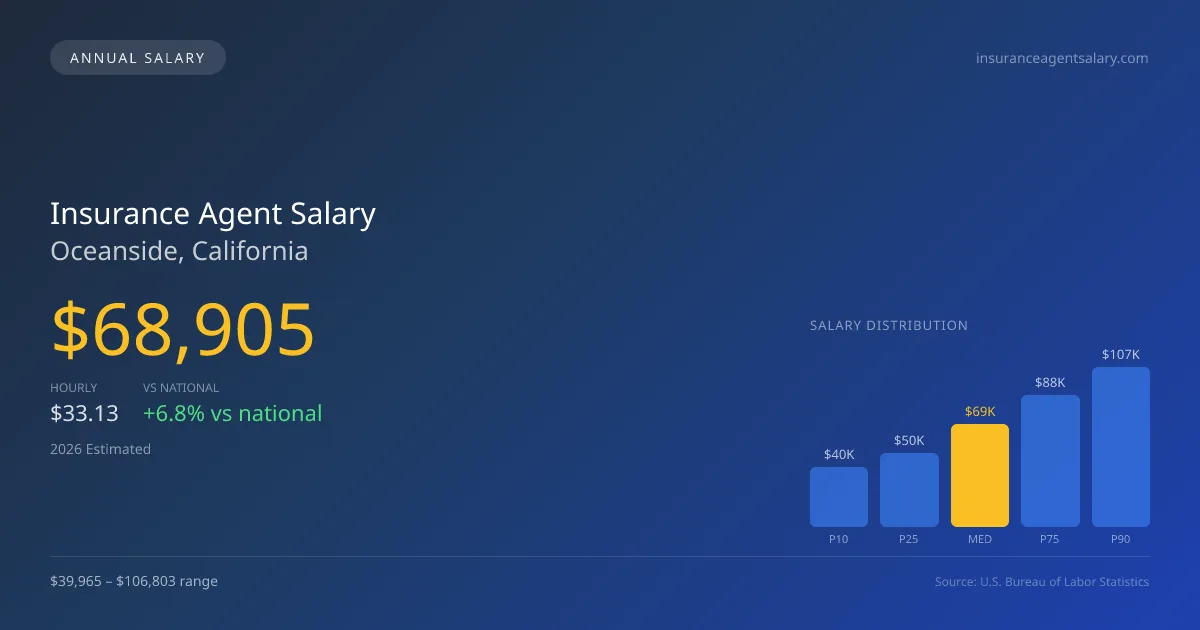
2026 Salary Percentile Distribution in Oceanside
In Oceanside, CA, the insurance agent salary spread from the 10th to 90th percentile is $66,838 (2026 est.). At $68,905, the local median is 6.79% above the national median of $64,522.
Salary Calculator
At 40 hours/week in Oceanside: You'd be in the lower-middle range
How Oceanside Insurance Agent Pay Compares
Oceanside median: $68,905/year (2026)
| Compared To | Median Salary | Oceanside Pays |
|---|---|---|
| California Average | $67,887 | +1.50% more |
| National Average | $64,522 | +6.79% more |
Insurance Agents in Oceanside, CA earn a median of $68,905 per year (2026 est.), which is 6.79% higher than the national median of $64,522 and 1.50% above the California state average of $67,887.
Cost-of-Living Adjusted Salary
Oceanside has a cost of living 13.10% above the national average.
Adjusted salary = nominal × (100 / CoL index). CoL index: 100 = national average.
Oceanside, CA has a cost-of-living index of 113.1 (above the national average of 100). While the nominal salary of $68,905 is competitive, the higher cost of living reduces purchasing power to an effective $60,924 — a 11.58% reduction.
Compare Purchasing Power
Select a city to see how your salary compares after cost of living
Select a city above to compare purchasing power
2019 BLS Actual
$54,401
2025 BLS Actual
$66,511
2026 Current Est.
$68,905
2019–2027 Growth
+31.2%
Salary Trajectory for Insurance Agents in Oceanside (2019–2027)
2019–2025: actual BLS OEWS data for this metro area. 2026+: CAGR 3.60% projection.
| Year | Annual Salary | Status |
|---|---|---|
| 2019 | $54,401 | Actual |
| 2020 | $55,725 | Actual |
| 2021 | $53,226 | Actual |
| 2022 | $61,791 | Actual |
| 2023 | $63,094 | Actual |
| 2024 | $94,130 | Actual |
| 2025 | $66,511 | Actual |
| 2026(current) | $68,905 | Estimated |
| 2027 | $71,386 | Projected |
Based on 7 years of BLS OEWS data for the Oceanside metropolitan area, the median insurance agent salary grew 22.3% from $54,401 (2019) to $66,511 (2025). At a 3.60% compound annual growth rate, salaries are projected to reach $71,386 by 2027 — a total increase of $16,985 (31.22%) from 2019.
Note: Historical values (2019–2025) are actual BLS OEWS figures for the Oceanside metropolitan area, sourced from annual Occupational Employment and Wage Statistics surveys. 2026–2026 figures are current estimates, and 2027 values are projections, calculated using a 3.60% CAGR derived from 7-year BLS historical data. Actual salaries may vary based on employer, experience, certifications, and local market conditions.
Salary by Experience Level
| Experience | Estimated Salary Range |
|---|---|
| 0-2 years (New Graduate) | $39,965 – $49,612 |
| 3-5 years (Mid Career) | $49,612 – $68,905 |
| 5+ years (Experienced) | $68,905 – $88,199 |
| 10+ years (Top Earner) | $88,199 – $106,803 |
Agent salary ranges estimated from BLS percentile data. Individual insurance agent compensation varies by employer, certifications, and specialization.
Insurance Agent Job Market in Oceanside
The cost of living index for Oceanside stands at 113.1, indicating that while salaries may be higher than the national average, take-home purchasing power may be impacted. Captive agents associated with major carriers like State Farm and Allstate typically earn more, but their compensation structure can cap long-term earnings potential. Independent agencies and large commercial brokerages employ a growing number of agents, often yielding higher commissions, especially in commercial lines, where compensation can be five to ten times that of personal lines. To maximize their earning potential in Oceanside, insurance agents should focus on cultivating substantial books of business, understanding the nuances of renewal commissions, and considering the shift toward independent and commercial lines to secure favorable pay and long-term financial growth.
More salary data for Oceanside, CA:
Frequently Asked Questions
How much do insurance agents make in Oceanside, CA in 2026?
Is Oceanside, CA a good place to work as a insurance agent?
Can insurance agents make $100K in Oceanside?
What is the cost-of-living adjusted insurance agent salary in Oceanside?
How much does a insurance agent make per hour in Oceanside?
Related Pages
Compare Salaries
Career Resources
Nearby Cities in California
Written by Jordan Lee, MBA
Career Analyst
Jordan has over 10 years of experience in the insurance industry. He specializes in property and casualty insurance. He has worked in both agency and corporate settings.
Methodology & Data Source
Salary figures on this page are 2026 projections based on the Bureau of Labor Statistics Occupational Employment and Wage Statistics (OEWS) survey, May 2026 release. The BLS reported a median annual salary of $66,511 for insurance agentsin the Oceanside metropolitan area. A 3.60% compound annual growth rate (CAGR), calculated from 6-year national BLS wage trends, was applied to project current 2026 compensation. Percentile ranges (P10–P90) represent the full salary distribution across experience levels and practice settings in this market.
Data Sources & Methodology
Salary data for Oceanside is estimated from official BLS state-level occupational wage data (2025), adjusted for regional cost-of-living differences using BEA RPP (Regional Price Parities).
2026 figures are projected from 2025 BLS data using a compound annual growth rate (CAGR) of 3.60%, derived from historical BLS wage trends for insurance agents (SOC 41-3021).
Compiled and verified by Jordan Lee, MBA, a licensed insurance agent with 10+ years of clinical experience. · View source data at BLS.gov